The z-Test: Two- Sample for Means tool runs a two sample z-Test means with known variances to test the null hypothesis that there is no difference between the means of two independent populations. This tool can be used to run a one-sided or two-sided test z-test.
Two P values are calculated in the output of this test.
- "P(Z <= z) one tail" should be interpreted as P(Z >= ABS(z)) or the probability of a larger z Critical one-tail value larger than the absolute value of the observed z value, when there is no difference between the population means.
- "P(Z <= z) two tail" should be interpreted as P(Z>= ABS(z) or Z <= -ABS(z)) or the probability of a z Critical two-tail value larger than the absolute value of the observed z value, where there is no difference between the two population means.
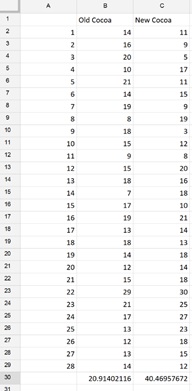
The example dataset below shows two independent populations taken from two bakeries in a small town. The first bakery sells "traditional" hot cocoa. However, in the month of February, the second bakery is selling "European" hot cocoa. Determine if sales for "European" hot cocoa out performed sales of "traditional" hot cocoa. The variances for each population has been calculated in row 30 using the Excel VAR() formula.

To run the z-test:
- On the XLMiner Analysis ToolPak pane, click z-Test: Two-Sample for Means.
- Enter B2:B29 for Variable 1 Range.
- Enter C2:C29 for Variable 2 Range.
- Enter "0" for Hypothesized Mean Difference. This means that we are testing that the means between the two samples are equal.
- Enter the Variance for Variable 1, 20.914.
- Enter the Variance for Variable 2, 40.470.
- Uncheck Labels since we did not include the column headings in our Variable 1 and 2 Ranges.
- Keep the Alpha = 0.05.
- Enter E1 for the Output Range.
- Click OK.

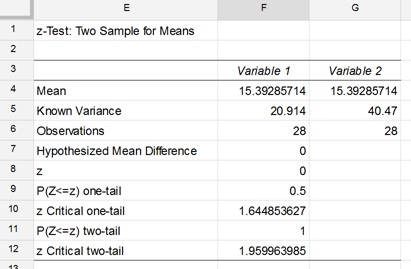
The results are below.

- Cells F4 and G4 contain the mean of each sample, Variable 1 = Traditional cocoa and Variable 2 = European cocoa.
- Cells F5 and G5 contain our entries for that variance of each sample.
- Cells F6 and G6 contain the number of observations in each sample.
- Cell F7 contains our entry for the Hypothesized Mean Difference.
- Cell F8 contains the result of the actual z-test. We will compare this value to the z-Critical two-tail statistic. Note: Use a one-tail test if you have a direction in your hypothesis, i.e. if testing that a value is above or below some level.
- In this example P(Z <= z) two tail (1) gives us the probability that a value of the z-Statistic (0) would be observed that is larger in absolute value than z Critical two-tail (1.96). Since the p-value is larger than our Alpha (0.05), we cannot reject the null hypothesis that there is no significant difference in the means of each sample.
