The t-Test Paired Two-Sample for Means tool performs a paired two-sample Student's t-Test to ascertain if the null hypothesis (means of two populations are equal) can be accepted or rejected. This test does not assume that the variances of both populations are equal. Paired t-tests are typically used to test the means of a population before and after some treatment, i.e. two samples of math scores from students before and after a lesson.
The result of this tool is a calculated t-value. This value can be negative or positive, depending on the data. Assuming that the population means are equal:
- If t < 0, P(T <= t) one-tail is the probability that a value of the t-Statistic woulbe observed that is more negative than t.
- If t >0, P(T<=t) one tail is the probability that a value of the t-Statistic would be observed that is more positive than t. /li>
- P(T <=t) two tail is the probability that a value of the t-Statistic would be observed that is larger in absolute value than t.
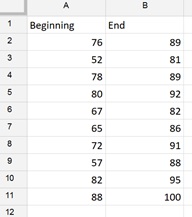
The example datasets below were taken from a population of 10 students. The students were given the same test at the beginning and end of the school year. Use the Paired t-Test to determine if the average score of the 2nd test has improved over the average score of the 1st test.

To run the t-test:
- On the XLMiner Analysis ToolPak pane, click t-Test Paired Two-Sample for Means.
- Enter A2:A11 for Variable 1 Range. This is our first set of values, the values recorded at the beginning of the school year.
- Enter B2:B11 for Variable 2 Range. This is our second set of values, the values recorded at the end of the school year.
- Enter "0" for Hypothesized Mean Difference. This means that we are testing that the means between the two samples are equal.
- Uncheck Labels since we did not include the column headings in our Variable 1 and 2 Ranges.
- Keep the Alpha = 0.05.
- Enter D1 for the Output Range.
- Click OK.


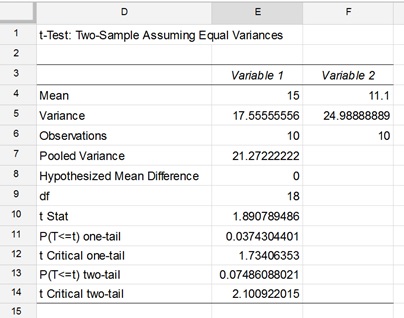
- Cells E4 and F4 contain the mean of each sample, Variable 1 = Beginning and Variable 2 = End.
- Cells E5 and F5 contain the variance of each sample.
- Cells E6 and F6 contain the number of observations in each sample.
- Cell E7 contains the Pearson Correlation which indicates that the two variables are rather closely correlated.
- Cell E8 contains our entry for the Hypothesized Mean Difference.
- Cells E9 contains the degrees of freedom, 10 – 1.
- Cell E10 contains the result of the actual t-test. We will compare this value to the t-Critical two-tail statistic. Note: Use a one-tail test if you have a direction in your hypothesis, i.e. if testing that a value is above or below some level.
- In this example P(T <= t) two tail (0.0000321) gives the probability that the absolute value of the t-Statistic (7.633) would be observed that is larger in absolute value than the Critical t value (2.26). Since the p – value is less than our alpha, 0.05, we reject the null hypothesis that there is no significant difference in the means of each sample.
